[日本語版]
本日、SORACOM Lagoon に新しい Panel を追加しました!
SORACOM Lagoon は 2018年7月Discoveryで発表したダッシュボード作成/共有サービスです。データ収集、蓄積サービス SORACOM Harvest に集められたデータを対象に目的に応じて複数のグラフ、テーブル、地図等を組み合わせたダッシュボードを作成し、それらを共有できます。
リリース直後から、たくさんのお客様にご利用いただき、フィードバックをいただくことができました。本日、2つのシナリオで新しいパネルソリューションの提供を開始しました。
Location aware
Lagoon を利用されているデータのほとんどはセンサーデータです。時間の経過とともにステータスが更新されます。時間軸によるトレンドの確認は、すでにLagoonにあるグラフパネルで可視化できます。しかし~、センサーの位置情報の可視化が重要なユースケースが多くありました。
今回追加した2つのパネルタイプは、これらの位置情報の可視化に適しています。SORACOM Map Panel は、GPSデータがセンサに含まれている場合、特にデバイスが移動体である場合に最適です。SORACOM Image Panel は、動的なセンサーアイコンをイメージに配置し、効果的にカスタムダイアグラムを作成することができます。
SORACOM Map Panel
センサーから送信された JSON に緯度および経度情報が含まれている場合、Map Panel は地図上のその位置にマーカーを配置するだけでなく、他のデータの値に応じて異なるマーカーアイコンを表示することもできます。 これにより、センサの位置とステータスの両方を一目で見ることができます!
Line Plotting
さらに、もう1つの機能は移動するデバイスに特に有効です。
指定された時間枠内での過去の位置情報を遷移をプロットすることができます。
アニメーションと組み合わせることで、GPSトラッキングダッシュボードを簡単に作成することができます。たとえば、すべての過去の場所を示すデータと最新のものだけが表示されるアイコンを設定します。 表示されるアイコンは車の速度に応じて変化することができ、80km/hを超えるとレースカーに変わります。
GeoJSON Support
最後に、マップ上に表示したい情報のすべてがセンサから来ているとは限らないため、GeoJSON をサポートしました。これにより、 http://geojson.io のようなエディタを使用して、カスタムマーカー、線、シェイプをマップに追加することができます。
上記のマップでは、カスタムマーカープロパティ(iconURL、iconWidth、iconHeight)を使用して世界中のソラコム社員の位置をマークしています。 正確なGeoJSONはここで確認できます。
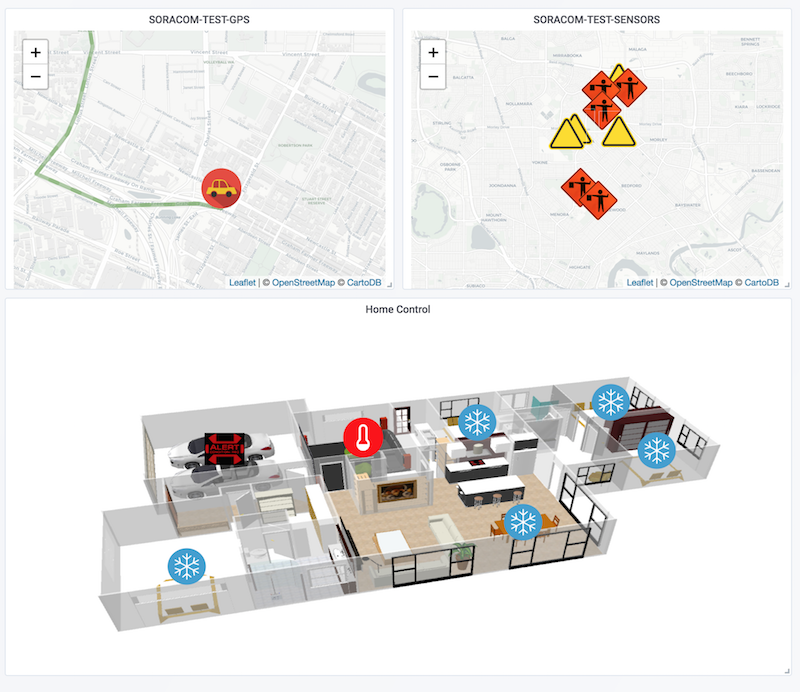
SORACOM Image Panel
Map panelはセンサーデータにGPS情報が含まれている場合に最適ですが、手動で配置する方が望ましい場合もあります。 これは、簡単にドラッグ&ドロップでカスタムダイアグラムを作成できる使用例です。
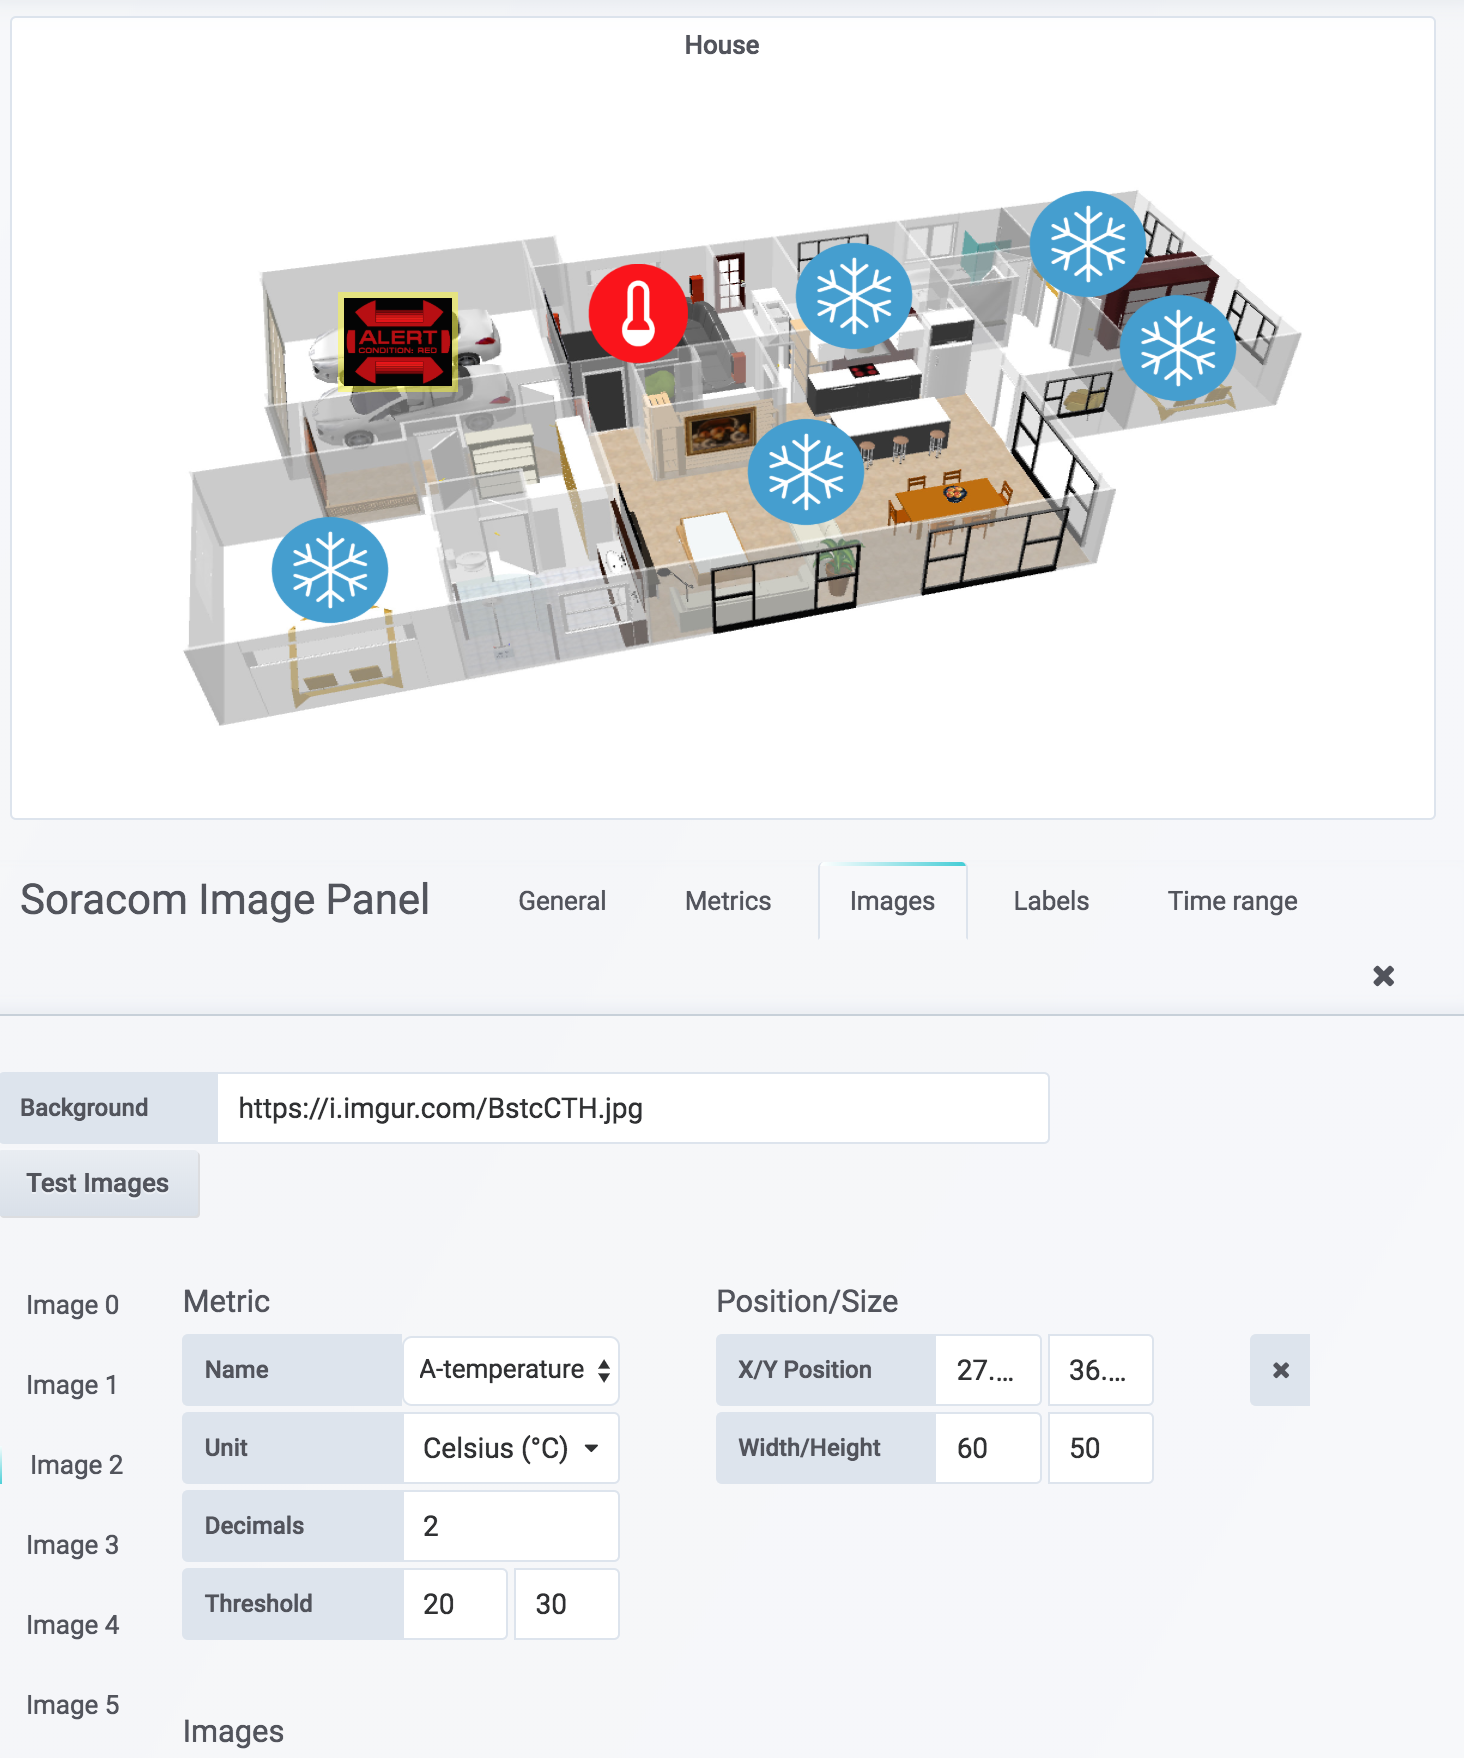
Map panel と同様に、送信されたセンサー情報に基づいて異なるアイコンを表示できます。 [画像の追加] ボタンをクリックして、メトリッククエリに割り当てます。
上記の例では、 “温度”プロパティを持つクエリ “A”が選択されています。 次いで、20〜30の閾値範囲を設定しています。センサーの読み取り値が摂氏30度の指定されたしきい値を超えると、カスタムアラートアイコンが表示されます。
デフォルトの画像が提供されている間は、指定されたしきい値(下/内/上)に直接関連するカスタムの低/中/高画像URLを指定し、表示されたアイコンを動的に変更します。 アイコンの位置とサイズは、入力ボックスで指定するか、ドラッグするだけで指定できます。位置は絶対的なものではないため、パネルのサイズを変更しても、アイコンは背景イメージとの相対位置を維持します。
SORACOM Map Panel and SORACOM Image Panelの2つのリリースで、さらに豊富で有益なダッシュボードを作成できることを願っています。 ぜひお試しいただき、ご意見やご提案をお待ちしております。また、ぜひさらなる改善のためにフィードバックをいただけますと幸いです。
Christian
[English version]
When we released Lagoon back at Discovery in July, we knew there would be use-cases we hadn’t accounted for, and that a lot more work was needed to be done. Lots of great Soracom customers quickly provided us with a roadmap for future enhancements. We’re happy to announce that we are providing new panel solutions for the two most popular scenarios.
Location aware
A large part of Lagoon’s devices are sensors, updating their status over time. For time based charts, our integrated graph panels have most situations covered. But sometimes the location of a sensor is just as important as the reading it returns.
Both new panel types are for these situations. The first, Soracom Map Panel is perfect for when GPS data is also included with a sensor, especially so if the device moves. The second, Soracom Image Panel allows you to place dynamic sensor icons onto an image overlay, effectively building a custom schematic.
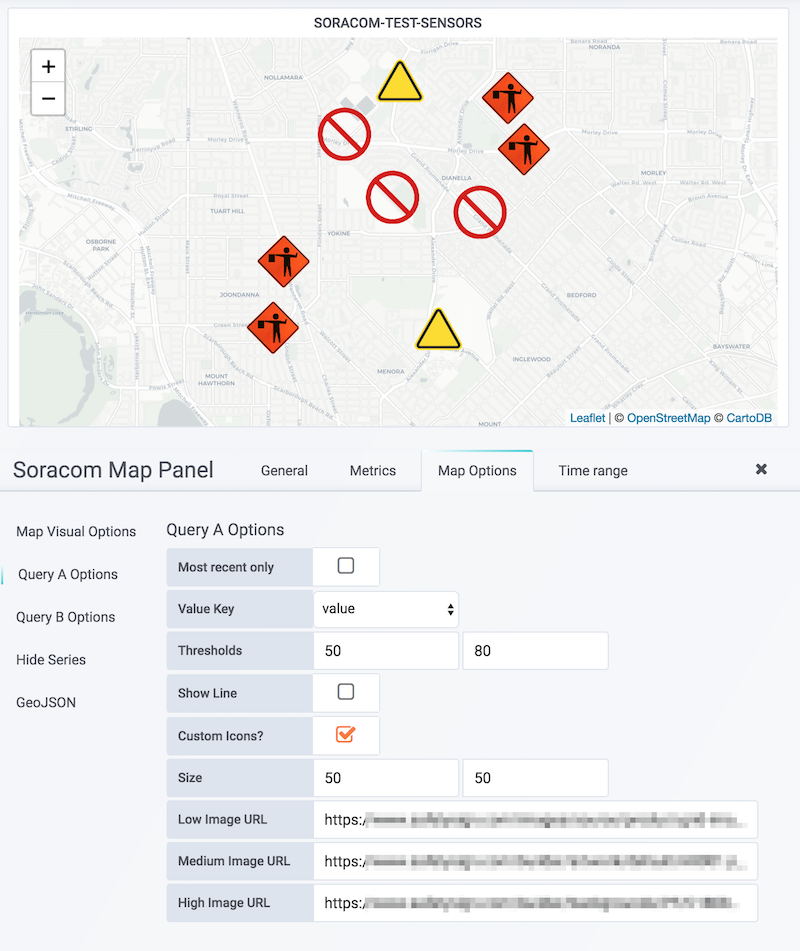
Soracom Map Panel
If your sensor’s posted JSON includes a latitude/longitude property pair, this new panel will not only place a marker at that position on the map, it can also display different marker icons depending on the value of any other posted property. This allows you to see at a glance, both the location and status of your sensors.
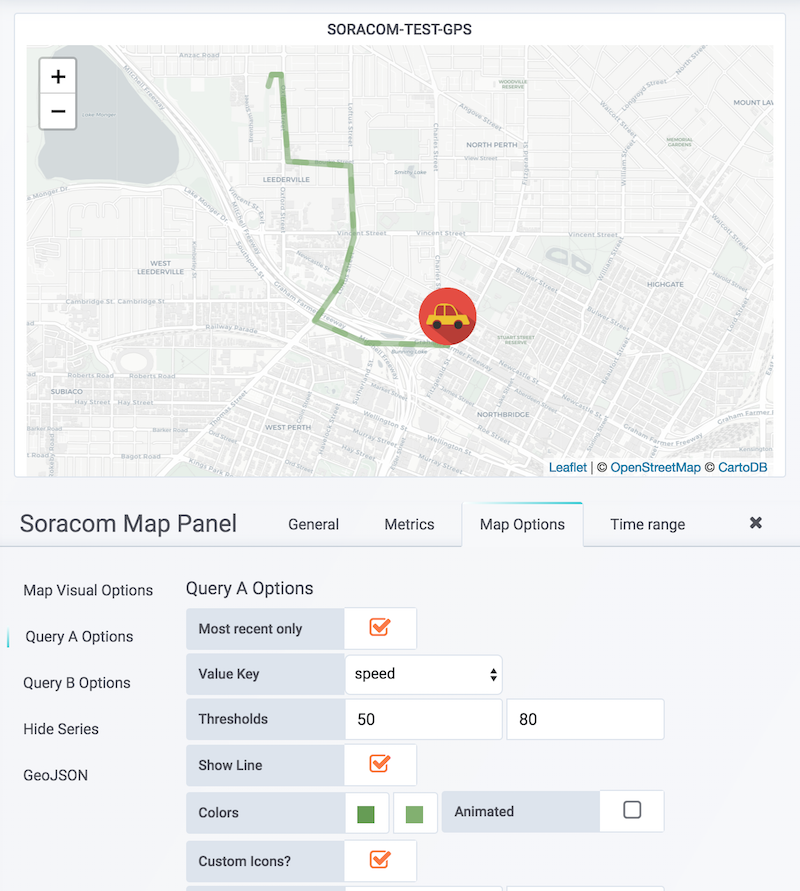
Line Plotting
Another feature we added, especially useful with moving devices, is the ability to plot a line, showing past movement within the specified timeframe. This combined with the new update animations allows you to create live GPS tracking dashboards with ease. Here we set up a line showing all past locations and an icon only displayed at the most recent. The icon displayed changes depending on the car’s speed, above 80 km/h it changes to a race car.
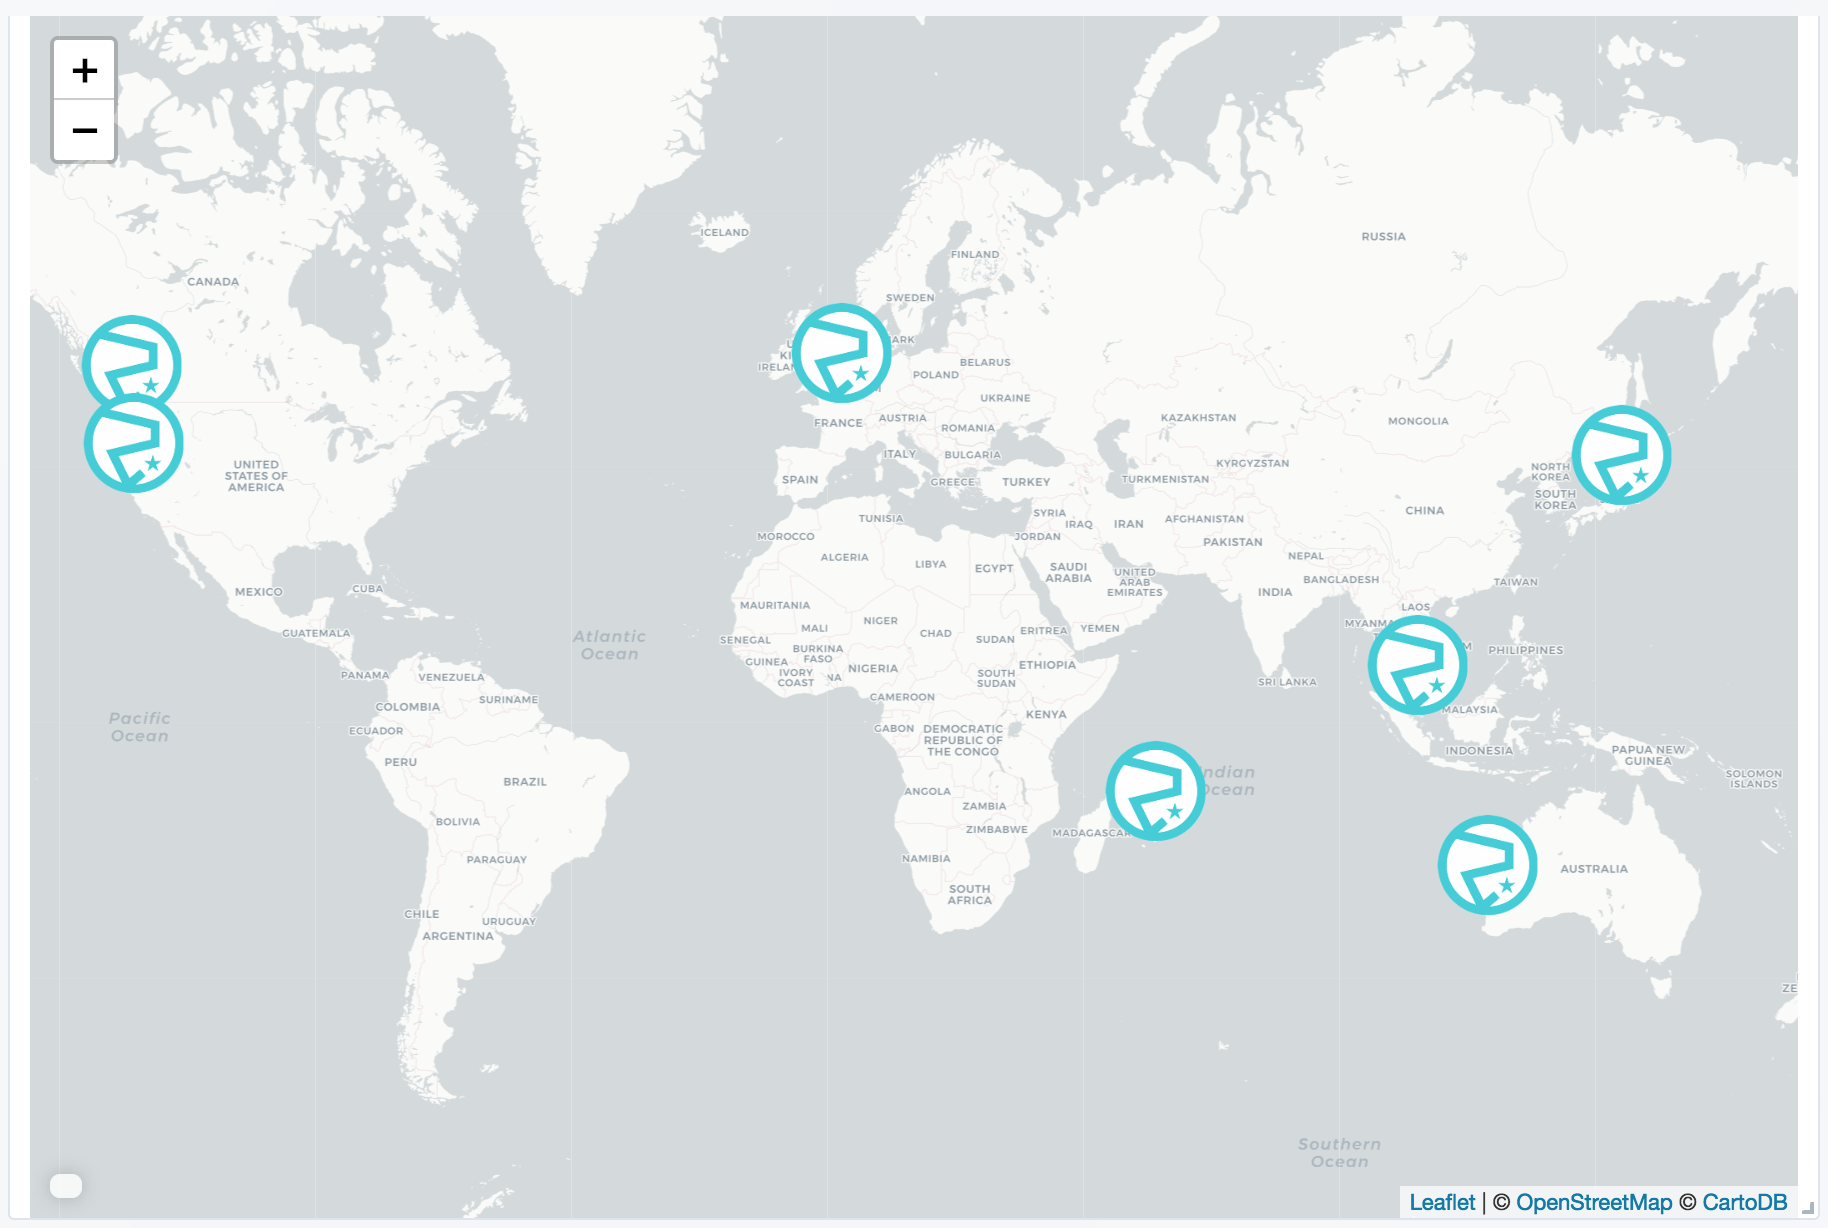
GeoJSON Support
Finally because perhaps not all the information you want to display on your map comes from a sensor, we have added GeoJSON support. This allows you to use an editor like the excellent http://geojson.io to add custom markers, lines and shape overlays to your map.
The above map uses just custom marker properties: iconURL, iconWidth and iconHeight to mark Soracom employee locations around the world. You can see/edit the exact GeoJSON right here.
Soracom Image Panel
While the Map panel is perfect for when your sensors data contains GPS information, often this isn’t the case and placing them manually would be preferred. This is the primary use case for our second panel, which allows you to create a custom schematic with easily draggable data dependent icons.
Much like the map panel, sensors can display different icons based on the incoming sensor reading. You simply click the “Add Image” button, then assign it to a metric query. In the example above, query “A” with the “temperature” property was selected. A threshold range of 20 to 30 was then set. When a sensor reading goes above the specified threshold of 30 degrees celsius, a custom alert icon is displayed.
While default images are provided, you can specify your own custom low/medium/high image URLs which relate directly to the specified threshold (below/within/above) and will dynamically change the displayed icon to suit. Icon position and size can be specified by the input boxes or simply by dragging. Position isn’t absolute, so icons will maintain their relative positions to the background image even when the panel is resized.
We hope these two releases, Soracom Map Panel and Soracom Image Panel, allow you to create even richer, more informative dashboards. Please have fun experimenting and don’t hesitate to give us any feedback or suggestions, we are always looking for areas to improve.
Christian