[日本語版]
English follows after Japanese
みなさん、こんにちは。ソラコムの山口です。
本日、SORACOM Lagoon の新パネル Dynamic Image Panel をリリースしました!!
当開発をリードしてくれたソラコムエンジニアの Christian のブログを翻訳しました。ところどころ不自然な言い回しがありますが、そこは私の翻訳のせいですので、目をつぶってお読みください!
私たちが新機能を追加するたびに、私たちの想像を超える利用方法のフィードバックいただいております。できる限り汎用的な機能を開発し、ユーザー自身が多彩なソリューション開発するためのサービスを提供しようと心がけています。
今回、SORACOM Lagoonに新たに追加するのパネルSORACOM Dynamic Image Panelも同様です。この新しいパネルでは、センサーのデータの組み合わせに基づいて様々な画像を表示することができます。
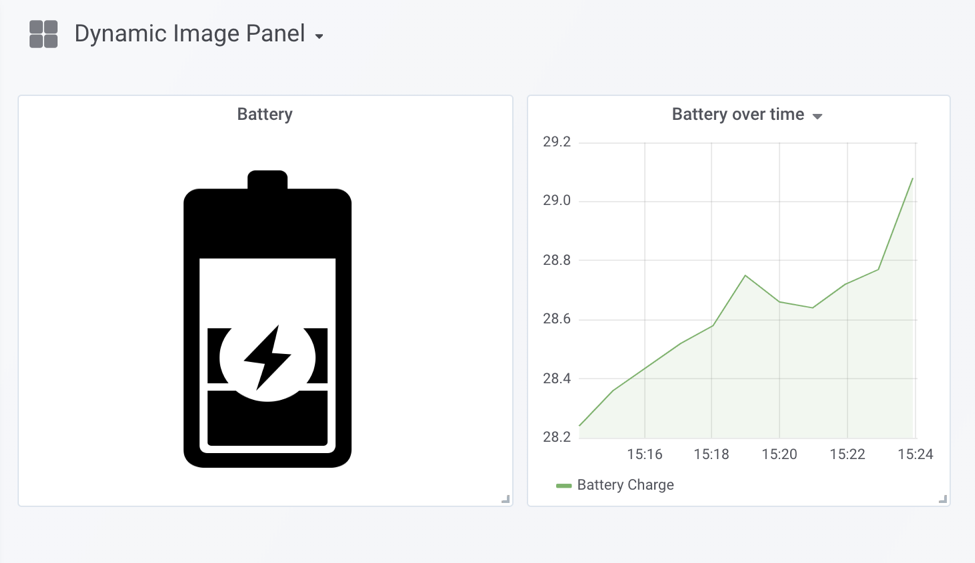
このパネルの特筆すべきは多数のセンサーデータの組み合わせによって表示する画像データを出し分けることができます。直感的にメッセージを伝えることができるようになりました。
このパネルのユースケースを例をあげて説明していきます。
例えば SORACOM Lagoon にデータを送信する電気自動車を持っているとしたら、充電ステータスをすばやく伝えるためのバッテリー表示を作りたいと考えています。
バッテリーの残量を表示し、現在充電中かどうかを確認する必要があります。
電気自動車は2つのセンサー値「バッテリー」を表す0から100までの値および「バッテリー充電」を表す値「0:充電していない」「1:充電中」を送信します。
表示をシンプルにするために低、中、高の3つのバッテリレベル状態を表示することにします。
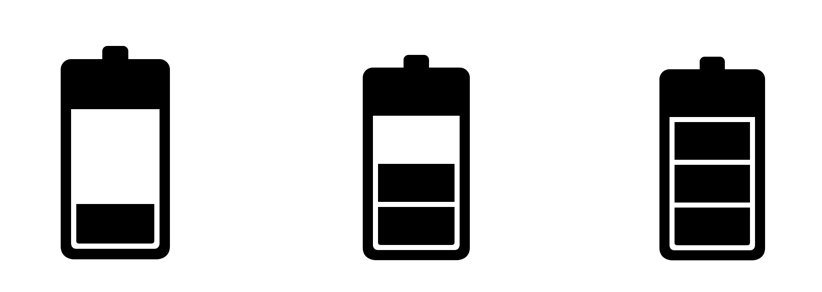
Dynamic Image Panelではセンサーデータとして上がってくる動的な値を利用して、選択する画像データのURLをダイナミックに指定することができます。
具体的なURLの指定方法は以下の通りです:
https://yourserver.com/images/sensor-${センサー1の値}-${センサー2の値}.png先ほどのバッテリーの例では以下のように指定します。
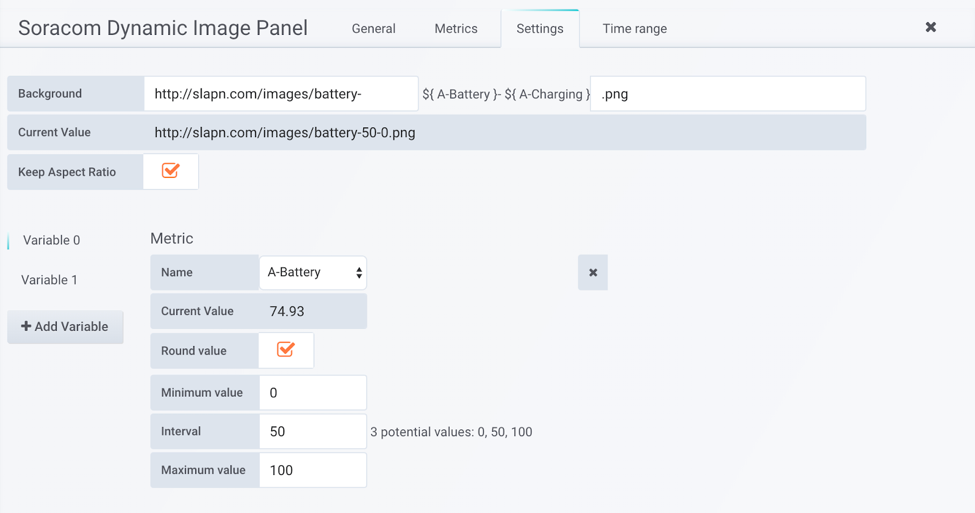
最初にバッテリーレベルを表す変数を追加します。
最小値を0、間隔を50、最大値を100として設定します。間隔の値はどれだけの精度で画像を表示するかを決める値となります。
この例では3つの状態しか表示されないので50の間隔としています。
25より小さい値は0(小)に丸められ、75より大きい値は100、その他の値は50(中)に丸められます。
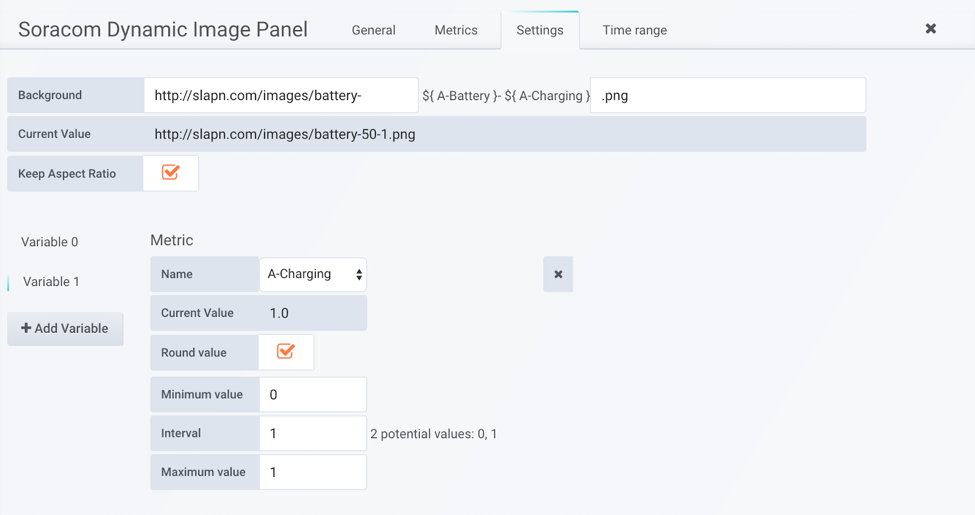
次に充電ステータスを表す変数を追加します。
今回は「0:充電していない」「1:充電中」の2つの値を利用します。
さて、私たちは画像を表示するための変数を設定することができました。
バッテリーレベルは3つの値をとる可能性があり、充電ステータスは2つの値をとる可能性があるため合計6枚(3×2)の画像が必要です。
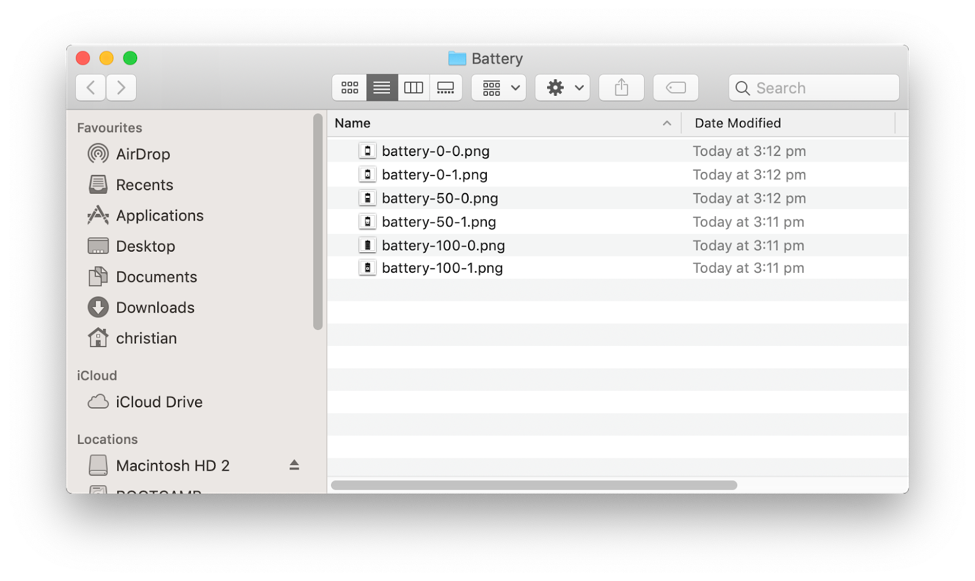
最後に、サーバー上のフォルダに画像をアップロードし、背景画像のURLテンプレートを更新します。
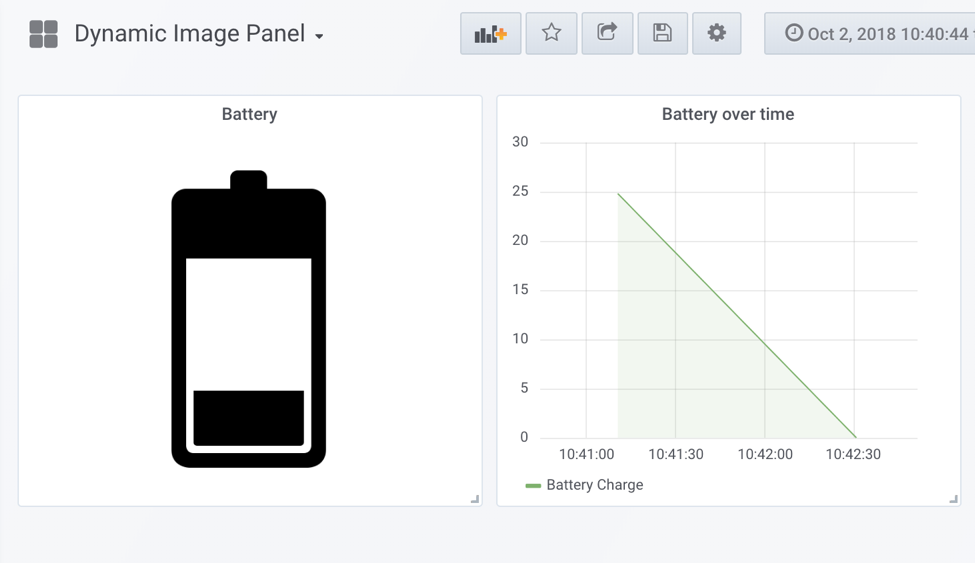
おっと、これは早く車を充電した方が良いですね。
複数の変数を追加して独自の画像データを表示することができるので、ダイナミックかつ汎用的なイメージビューアーとしてパネルの作成ができます。
考えられるユースケースは視覚的なアラート、天気予報などが考えられます。実際にこのアイディアは風の方向と速度に応じて表示する画像を出し分けたい。というお客様の声から生まれました。
私たちはあなたがこのDynamic Image Panelを使ってくれることをとても楽しみにしています。いつものようにご質問やご意見をお待ちしています。
Christian (Keith訳)
[English version]
Whenever adding a new feature at Soracom we know some of our customers will want to use them in unforeseen ways. As such we try to make everything as flexible as possible, providing services to enable you to build your own solutions.
This is certainly the case with our latest Lagoon addition, the Soracom Dynamic Image panel. What this new panel allows you to do is display different images based on incoming sensor data combinations.

The beauty of this panel is it can take a possibly large number of sensor values and allow you to convey the message using a finite number of images.
The potential uses of this panel are probably best explained through an example.
Imagine we have an electric car sending data to SORACOM Lagoon and we would like to build a battery display to quickly convey the charge status. It needs to display battery level, and also whether or not the car is currently charging.
Our car transmits two sensor readings, Battery, a value from 0 to 100 representing the charge in the battery, and Charging, with two possible values, 0: not charging, and 1: charging.
To make display simple we choose to display three battery level states, low, medium and full charge.

The Dynamic Image Panel allows you to specify a url pointing to your server of choice with a dynamic section that can be populated with your sensor data. Allowing you to build image urls in this fashion:
https://yourserver.com/images/sensor-${SENSOR1-VALUE}-${SENSOR2-VALUE}.pngSo for our battery example we add the following to our Dynamic Image Panel

First we add a variable that reflects the battery level, with a minimum value set to 0, an interval of 50 and a max of 100. The interval value is the true determining factor in how many images (potentially how accurately) you would like to represent your data. In our example we only have 3 states to display, so an interval of 50 gives us the perfect incrementer. Any value lower than 25 will be rounded to 0 (low) and any value higher than 75 will be rounded to 100 (full charge). Any other value is rounded to 50 (medium).

Next we add a variable to reflect the charging status, this time we want only two possible values, zero and one.
Ok now we have a variables setup we need our images. Battery level had 3 possibilities and charging status had 2, meaning a total number of 6 images (3 x 2) required.

Finally we upload the images to a folder on our server and update the background url template to suit.

Oh, I think we need to charge our car😉.
Since you can add multiple variables and use your own images, this really allows you to build completely custom displays. Possible use-cases range from visible alerts to weather reporting. In fact the idea initially spawned from one of our customers needing to display wind direction and speed as an image.
We look forward to seeing what you create, and as always please don’t hesitate to contact us with suggestions or queries!
Christian
